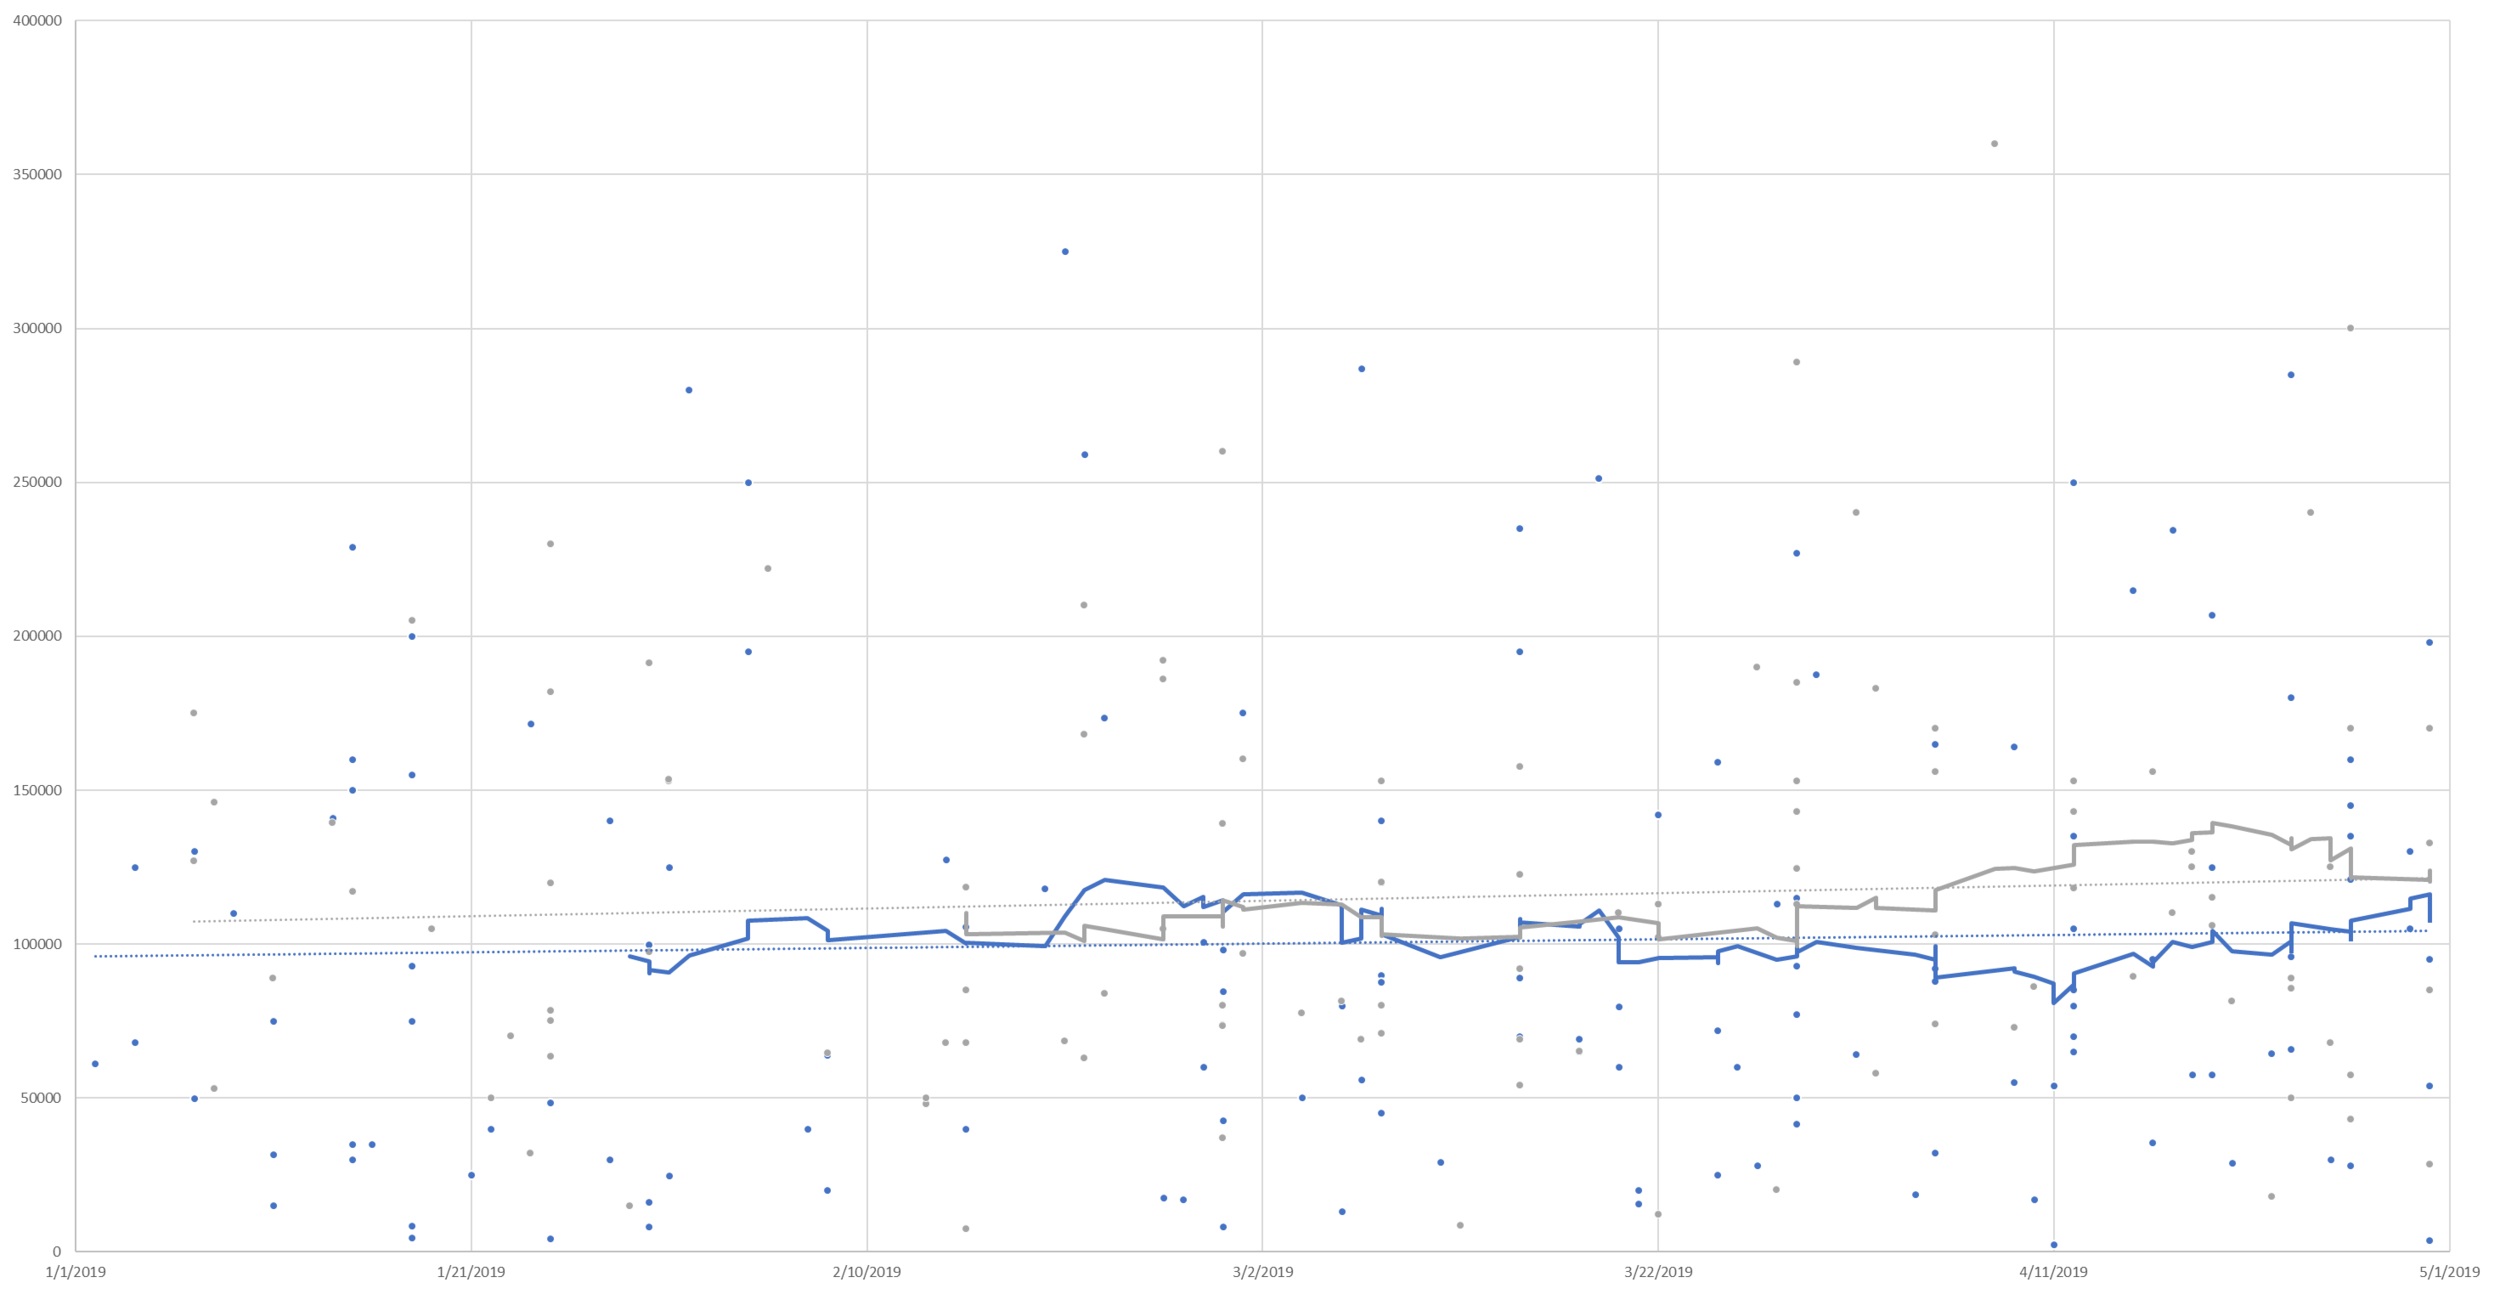
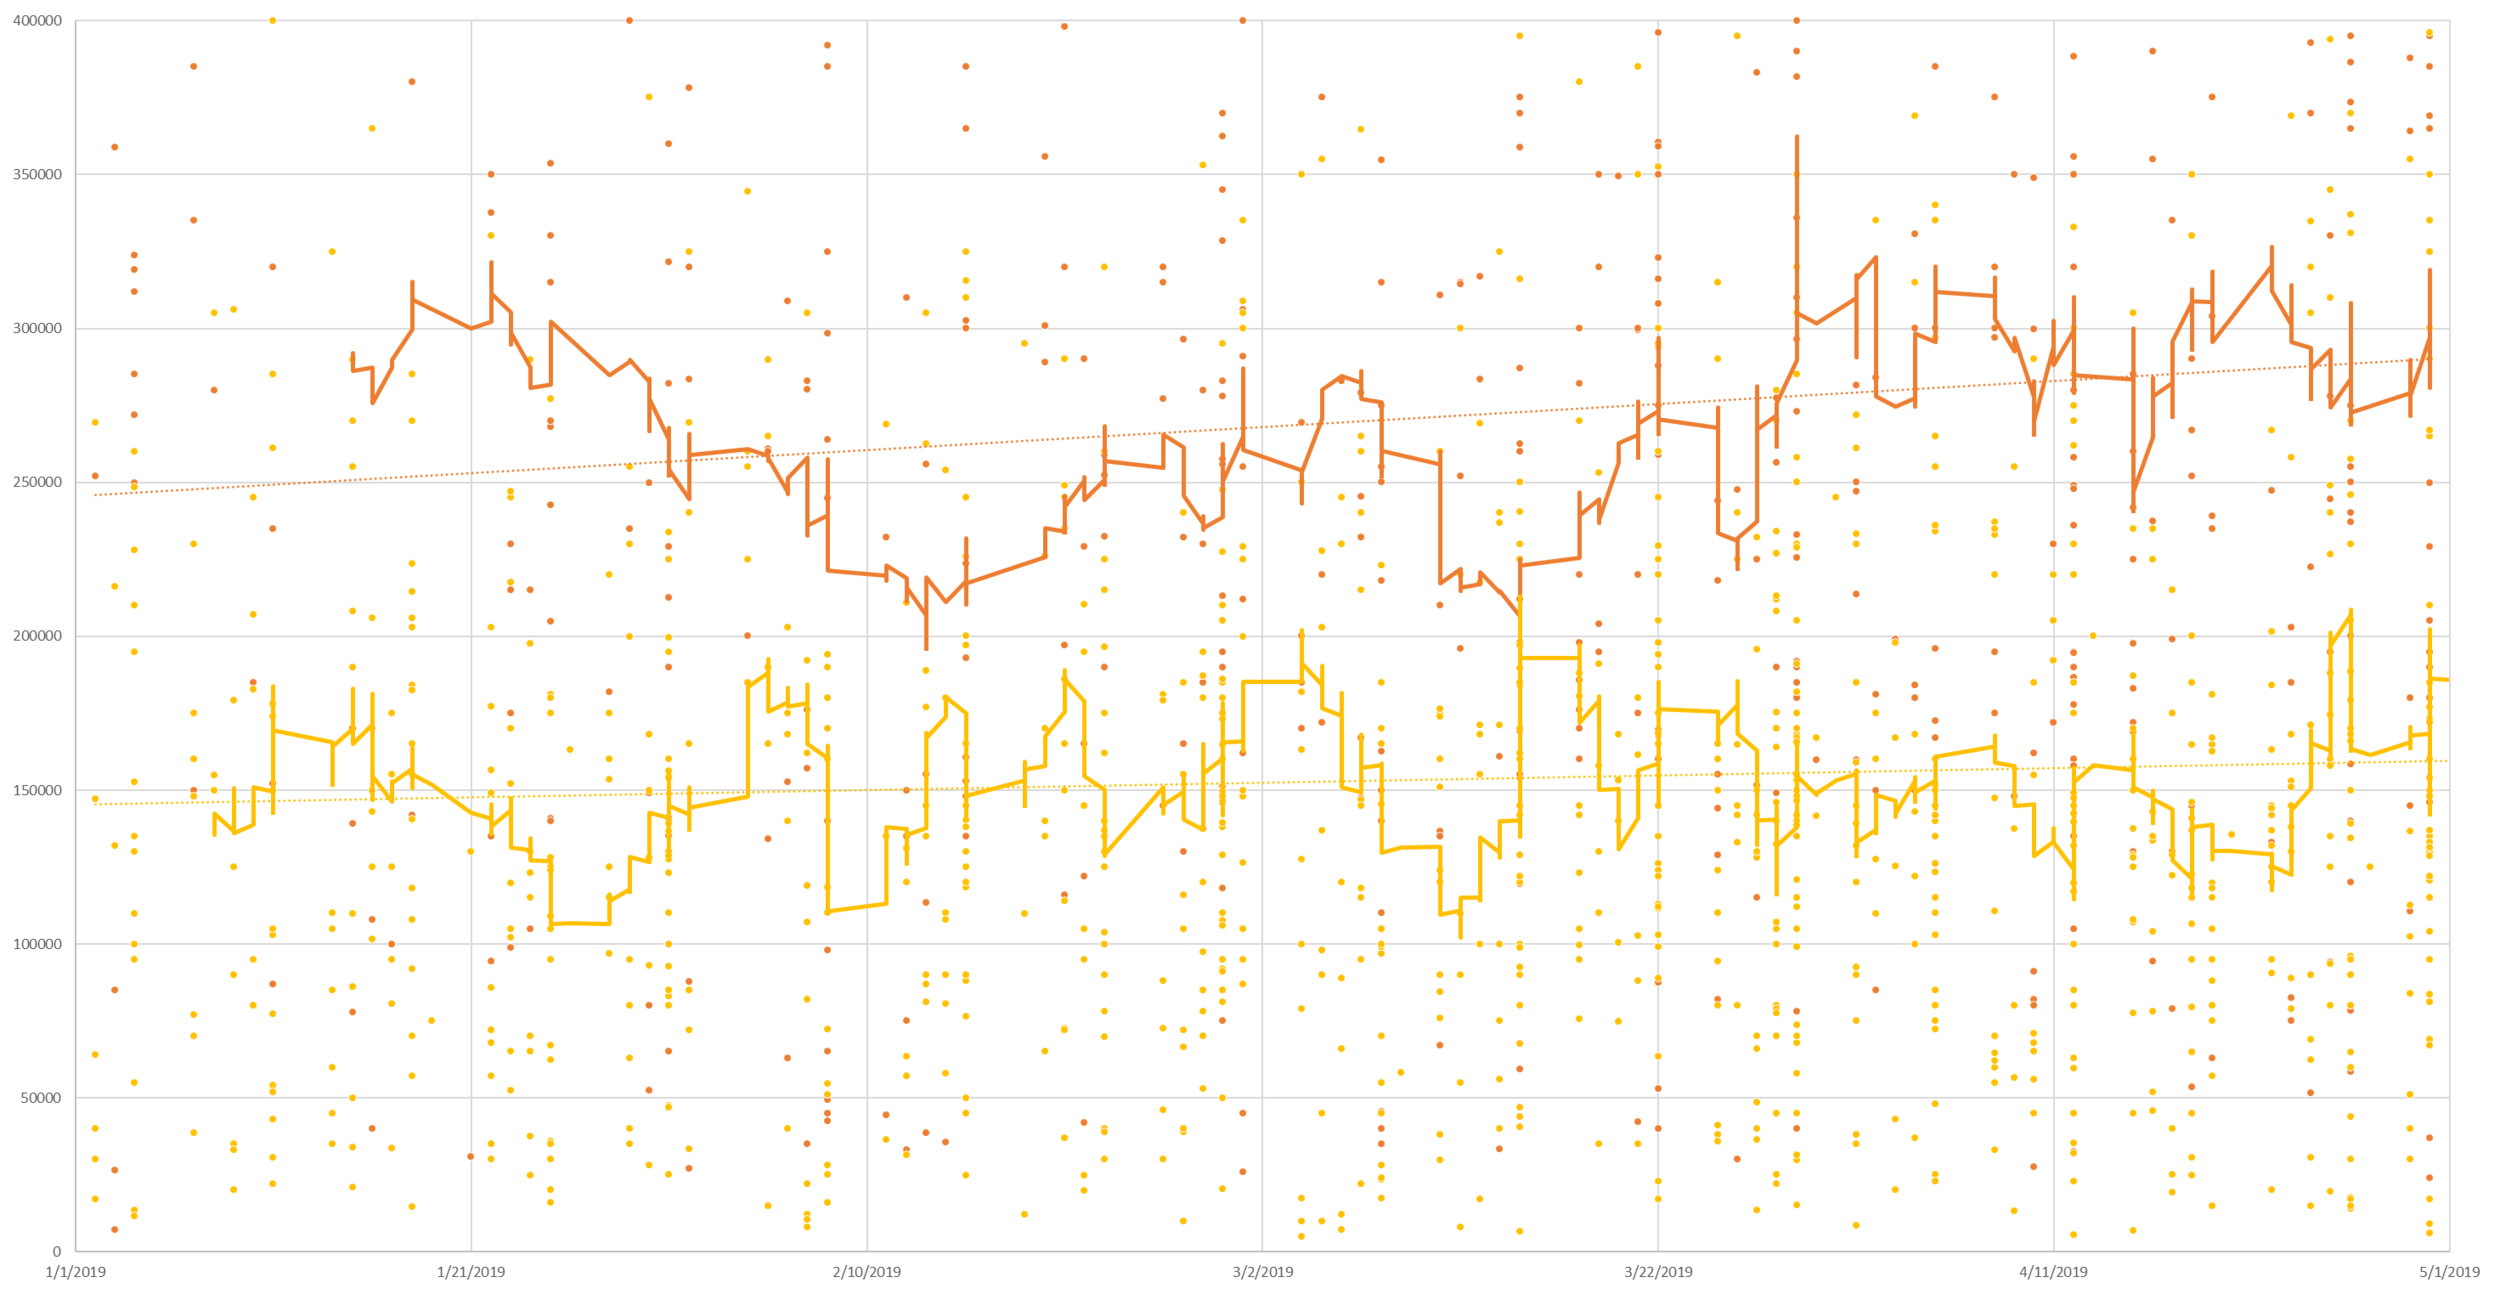
A note to begin: None of the above are singular market areas. In the two leftmost graphs are whole counties. They are placed together only because they have somewhat similar price ranges. Each of these areas has dozens of markets within them, and to represent the county trend as the market trend would be foolish. On every report that we produce we analyze the micro market of the subject and the surrounding competing markets when needed. However, to do this for a blog like this, would be to time intensive.
First up, let's look at Armstrong and Indiana Counties above (Armstrong: Blue / Indiana: Grey / 30 Day moving averages). These are both rural counties with some pockets of built-up areas (Indiana Borough, Kittanning, Homer City, Blairsville, Ford City, etc). Armstrong County as a whole has experienced typical seasonality, with a lower number of homes in the winter selling for slightly lower than the median prices would typically indicate, and a rebound towards the mean as we move into the late spring and the market begins to heat up. Indiana County, however, continues to struggle with low demand and a faltering median home price. While Indiana began to redound from typical seasonality, the month of April saw yet another decline. This is consistent with a now 2-year decline in home values in Indiana County. Leading this trend are the rural areas of the county, however, even White Township (the area just outside of Indiana Borough) has even recently begun to show signs of decline. Homer-Center School District is showing declines of as much as 7.5% per year, however, even the higher end homes of White Township are now showing a decline of 1.5% per year. Listing prices in Indiana County have begun to be in step with this (whereas a year ago they were increasing as prices were falling) however the degree to which listing prices are decreasing is lagging market prices similar to before. Overall, Armstrong County has a generally stable market, while Indiana County has weakening marketability (in part due to the past reassessment, more recent job closures, the declining population of IUP). While White Township had previously appeared to be resistant to this decline, it now appears to be moving with the county overall. It is possible that in the next year this trend could spill into the one area that has been resistant to the trend thus far: Indiana Borough.
In the year ending April 30, 2019, there were 451 sales in Armstrong County, while there are 227 homes currently on the market (Absorption rate of .166), indicative of a balance for the county which would likely indicate a continuing stable market. In the year ending April 30, 2019, there were 441 sales in Indiana County, while there are 384 homes currently on the market (Absorption rate of .096), indicative of an oversupply for the county which could continue to put downward pressure on home prices.
Next up, Butler and Westmoreland County above (Butler: Orange / Westmoreland: Yellow / 30 Day moving averages). These counties have mixtures of rural (Derry Twp and Karns City area for example) as well as very dense population centers nearer to the city (Cranberry Twp and Murrysville - not saying these are comparable, just having some similarity of density. Cranberry has experienced rapid growth in the last 15 years, which is in part reason for the higher sales prices) with wide ranges of appeal between them. Again, both are moving higher after seasonal softening in the winter months, however, Butler County with more sales is advancing more rapidly. Butler County has moved in a relatively steady direction from the winter lows, however, Westmoreland County appears to have had a week late March into early April. Reasons for this trend in relation to their neighbor Butler aren’t immediately apparent, but it is worth observing.
In the year ending April 30, 2019, there were 2,131 sales in Butler County, while there are 1,038 homes currently on the market (absorption rate of .171), indicative of a market in balance. In the year ending April 30, 2019, there were 3,768 sales in Westmoreland County, while there are 1,729 homes currently on the market (absorption rate of .182), indicative of a market in balance, or with a very slight undersupply.
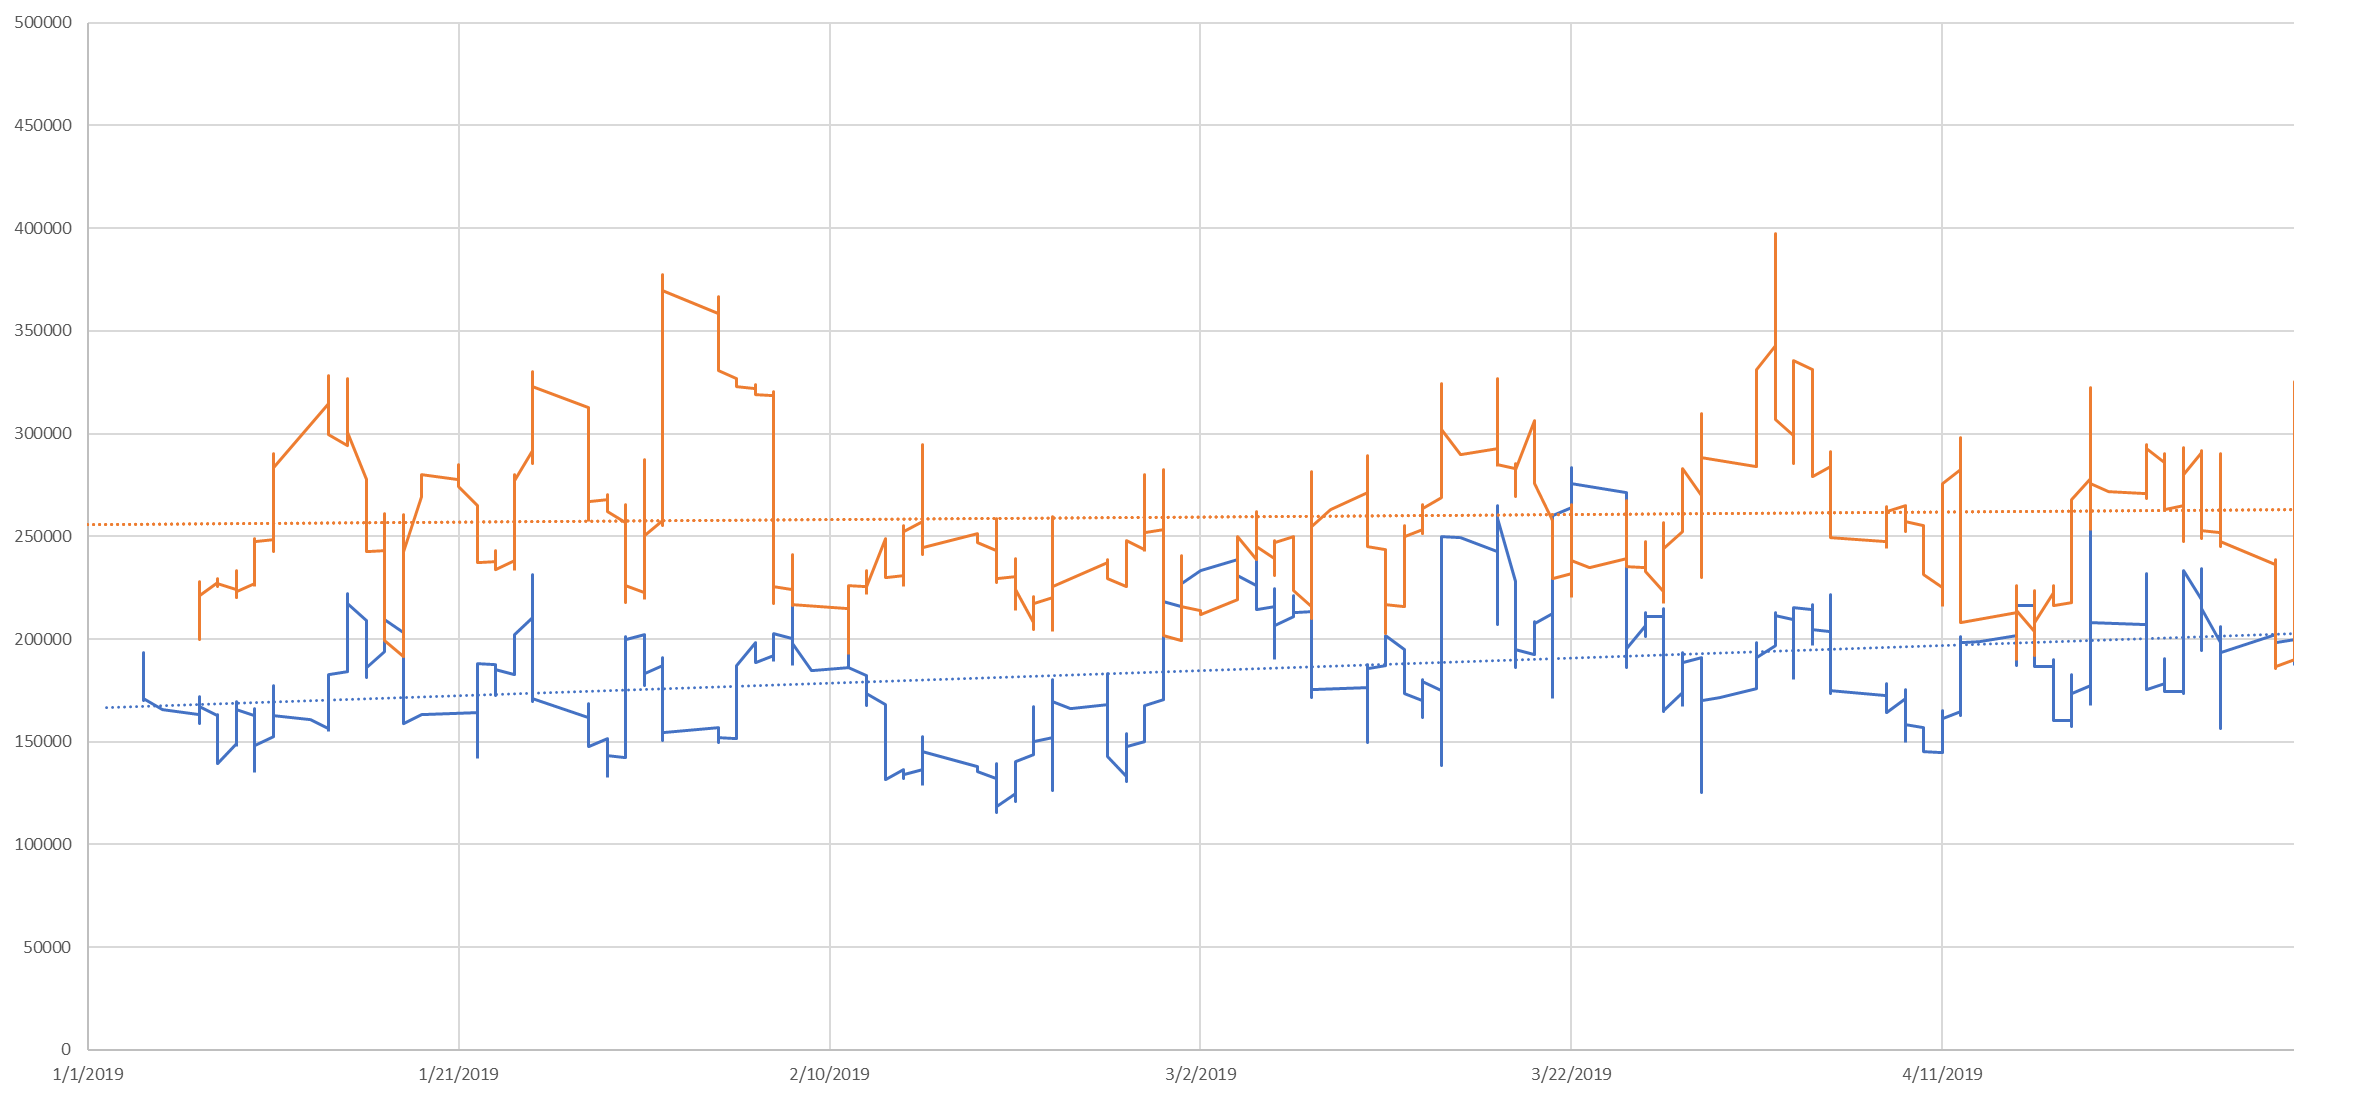
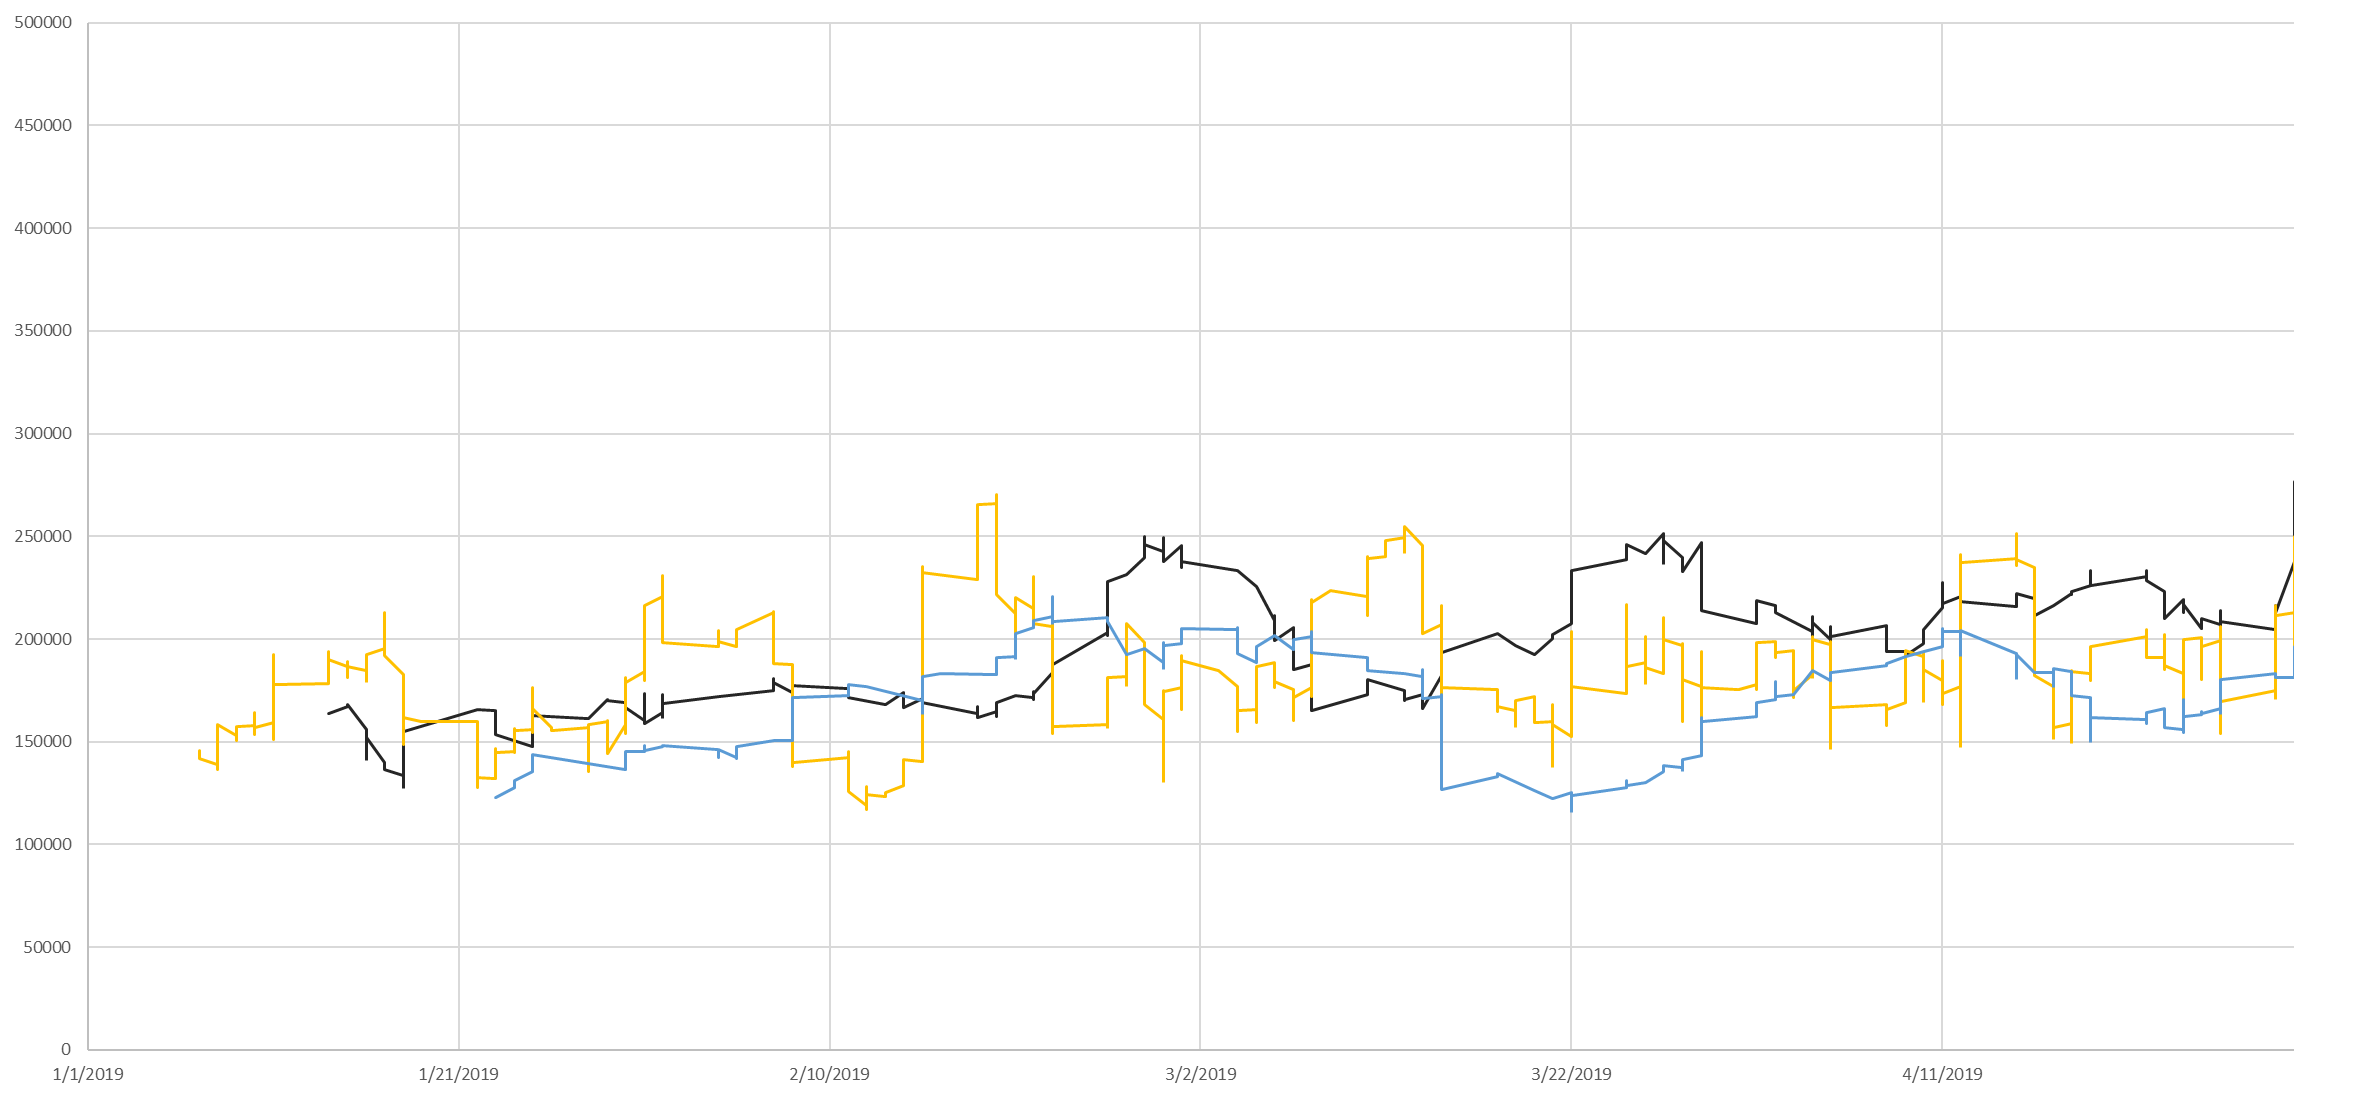
Finally, the right two graphs are the 5 divisions of Allegheny County. These areas are highly complex, with massive differences in market areas even within these five divisions. Here we’ll offer the Absorption rate and linear regression analysis for the year ending on April 30, 2019, with current market data for listings.
Allegheny East (Dark blue line above) had 4,289 sales in the last year with a total of 2,050 properties currently on the market (Absorption rate of .174), indicating that supply and demand are in balance. It started as the second highest median sales price area and ended the third highest. This was the third fastest growing area of the five for that time period.
Allegheny North (Orange line above) had 4,246 sales in the last year with a total of 1,687 properties currently on the market (Absorption rate of .210), indicating that there may be an undersupply. This started and ended the first four months with the highest median sale price and had the slowest appreciation of the five areas.
Allegheny Northwest (Black line above) had 1,259 sales in the last year with a total of 472 properties currently on the market (Absorption rate of .222), indicating that there may be an undersupply. It started as the 4th highest median sales price of the four and ended the first four months as the second highest median sales price. This was the fastest growing median sales price of the five areas for the first four months of this year.
Allegheny South (Yellow line above) had 4,264 sales in the last year with a total of 1,492 properties currently on the market (Absorption rate of .238), indicating that there may be an undersupply. It started as the third highest median sales price area and ended the fourth highest. This was the fourth fastest growing area of the five for that time period.
Allegheny West (Light blue line above) had 937 sales in the last year with a total of 330 properties currently on the market (Absorption rate of .237), indicating that there may be an undersupply. This started and ended the first four months with the lowest median sales prices. This was the second fastest appreciating market over this period.


