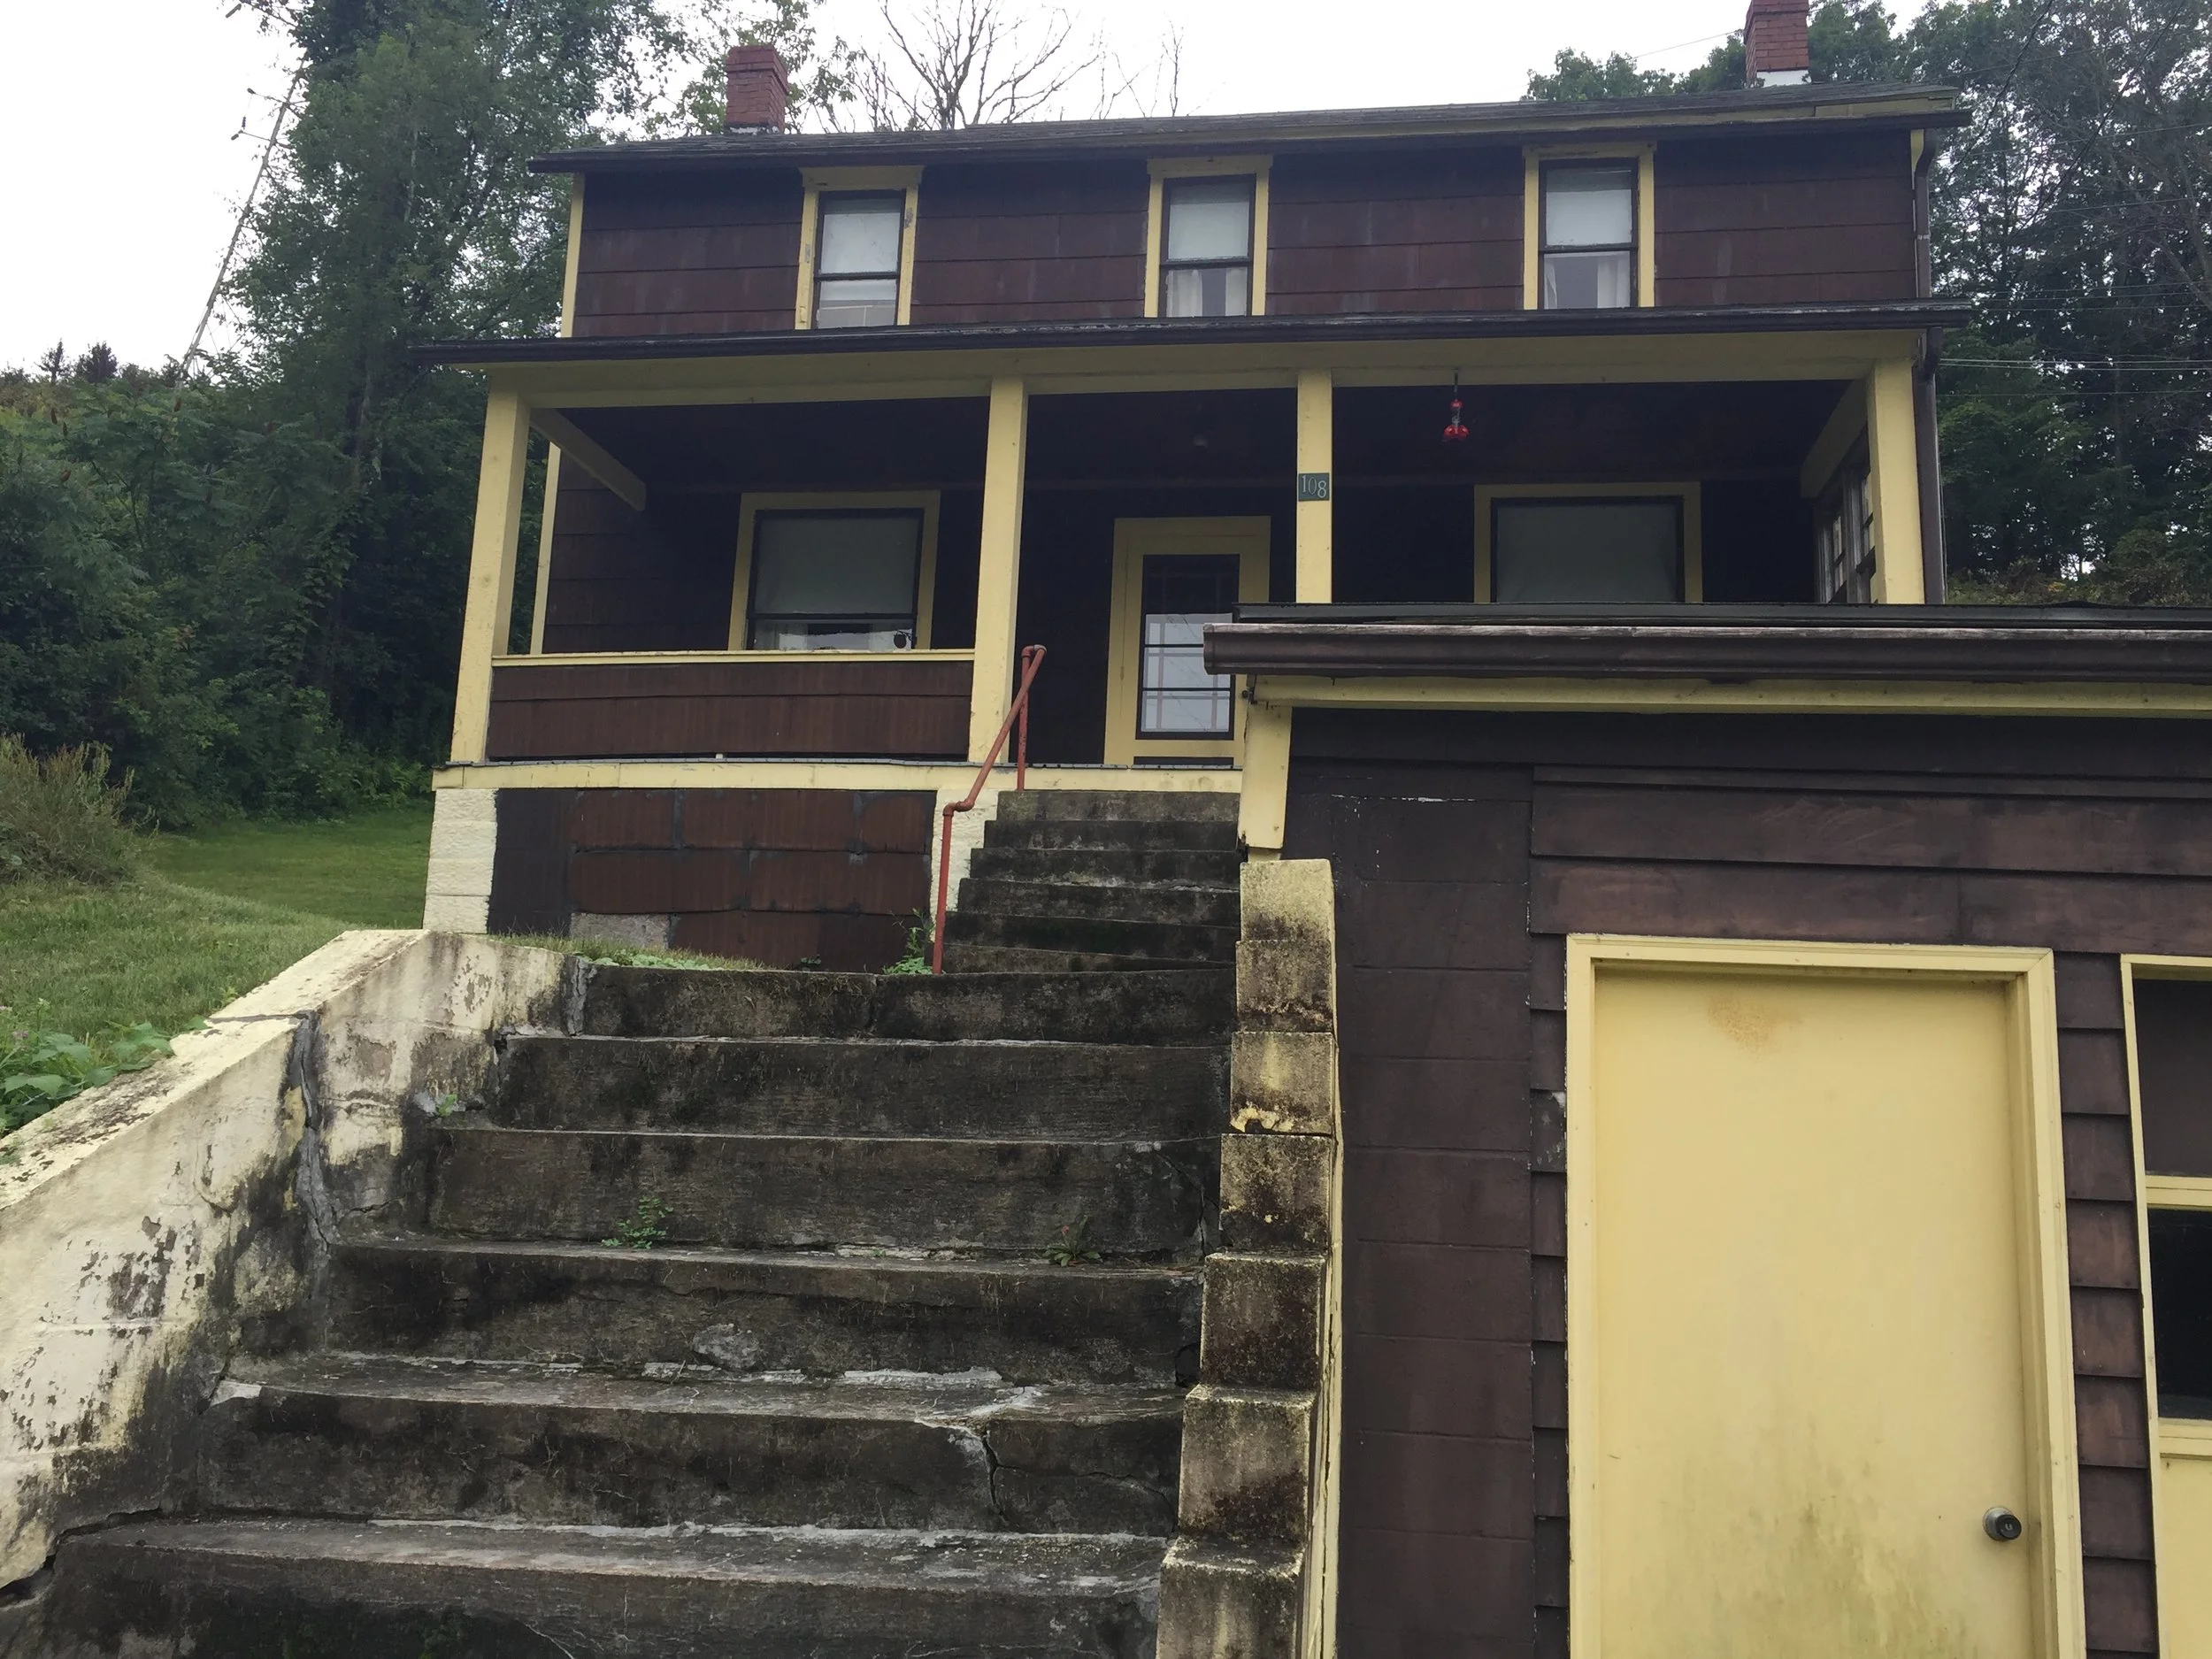

The classic cracking/scaling pattern of lead based paint. If you see this, there is a high likelihood that your home/structure has lead based paint.
Since the ongoing crisis in the Flint Michigan water supply, lead has been in the news nationwide. Lead is one of the most destructive substances to childhood development as it attacks the brain and central nervous system, and at highest levels can cause coma, convulsions, and death.
“At lower levels of exposure that cause no obvious symptoms lead is now known to produce a spectrum of injury across multiple body systems. In particular lead can affect children’s brain development resulting in reduced intelligence quotient (IQ), behavioural changes such as reduced attention span and increased antisocial behavior, and reduced educational attainment. Lead exposure also causes anaemia, hypertension, renal impairment, immunotoxicity and toxicity to the reproductive organs. The neurological and behavioural effects of lead are believed to be irreversible.”
With such horrifying effects, it is no wonder why the FHA / USDA and VA will not underwrite a loan unless Lead Based paint is properly treated. Today we will tackle some in-home investigating and treatments that you can perform to keep your family safe:
Investigating Lead Paint - excerpts taken from House Logic
The EPA has recognized the following in-home tests for discovering if your home has lead paint present:
For wood and metal surfaces: https://leadpaintepasupplies.com/lead-test-kits/
For wood, metal, drywall and plaster surfaces: https://www.esca-tech.com/ProductDetail.php?category=2700&productnum=LPTK
These tests work in a similar fashion, in which a swab of the surface is taken and a chemical reaction takes place in the presence of lead in order to reveal a color indicator.
Please note: While these tests may give you peace of mind, they will not suffice to exclude your home from needing larger remediation in the case of FHA/USDA/VA financing for a loan. The level of testing that would be required by federal guidelines is usually far higher than the cost to encapsulate any supposed lead paint.

Remediating Suspected Lead Based Paint
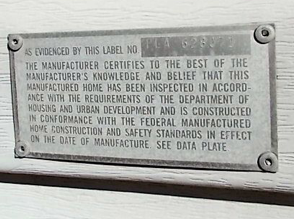
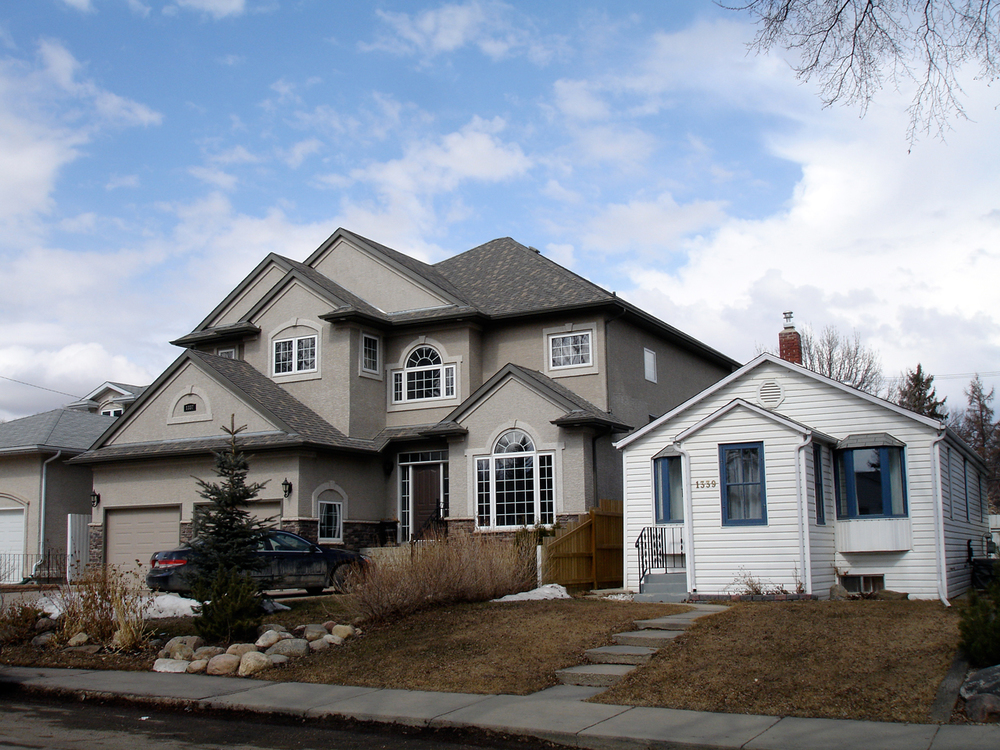
HUD/EPA’s policy infers that there is a high likelihood that any home built prior to 1978 has had lead-based paint at some point, and so all homes built before this date MUST have all chipping and peeling paint remediated by the following methods:
The surface must be scraped to remove all loose and peeling paint. Those chips can not be left on the ground however, as this is a risk to the ground and water being contaminated with lead.
The surface must then be painted to encapsulate the remaining surface.
Dust is the primary means that lead can enter the body, so this process should be performed carefully. HUD provides extensive guidelines for the entire process, available here.
Information
https://www.who.int/news-room/fact-sheets/detail/lead-poisoning-and-health
https://www.hud.gov/program_offices/healthy_homes/healthyhomes/lead
https://www.epa.gov/lead/protect-your-family-exposures-lead
https://www.webmd.com/women/lead-paint#1
Treatment
https://www.health.ny.gov/environmental/lead/renovation_repair_painting/encapsulants.htm