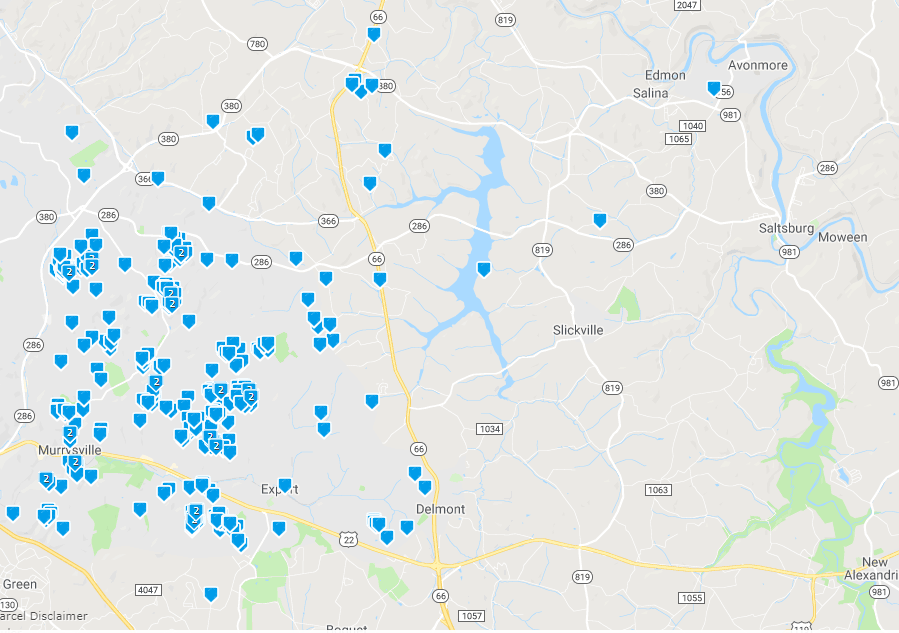
Today we turn our attention to high value homes and a factor that affects market value. For this we will take a birds eye view of an area. This is a look at two school districts’ sales over the past 10 years at the $400,000+ price range. If you had to draw a line dividing the two school districts, without any other help, where would you draw it?
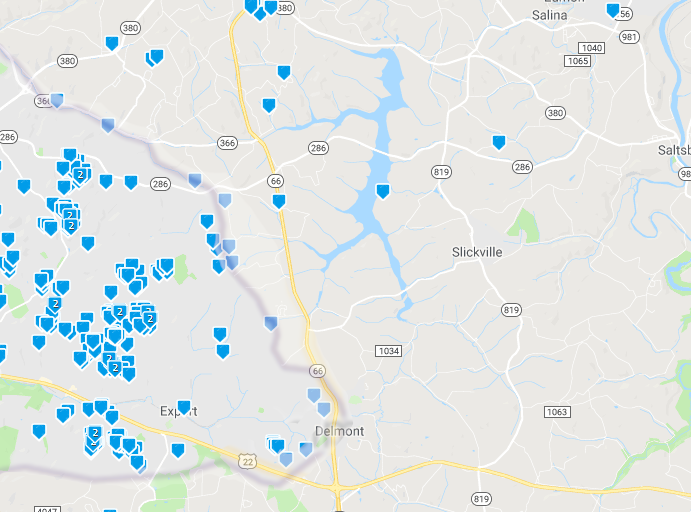
Zooming in on the southern end of the map we see the density remain in the south west portion, and drastically become more spread out to the east and north.
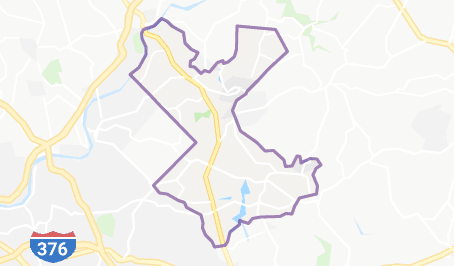
Using the above school district maps we see that the density of $400,000+ sales over ten years highly corresponds to these maps. In the same way that you might draw a line with a pen on the maps above, for ten years buyers have been drawing the line with the wallets.
But why? Franklin Regional is closer to the metro area and its amenities, but the sharp line indicates that this is not the only story. If we look at homes of $400,000+ in the Kiski School District over that same time (32 vs. the 305 in Franklin Regional), we see a median sale price of $442,500 (vs $553,827 in Franklin Regional) and a median acreage of 8.73 acres (vs 1.55 acres in Franklin Regional).
Buyers and sellers are sending a clear message - these two markets are not comparable. If you ever represent a property on the border of a school district, before you assume that you can use sales from across the border, make sure that the market data supports that assumption.
For more on this: https://www.housingwire.com/articles/49830-half-of-homebuyers-with-kids-base-purchase-on-school-district?fbclid=IwAR33nnrqBUS-MEkKBiP8nq6lvwiEnb1RGQbyHcLwjkLZKOzQm0jdfZhe-sc


